♻️ E-Waste Impact Visualizer
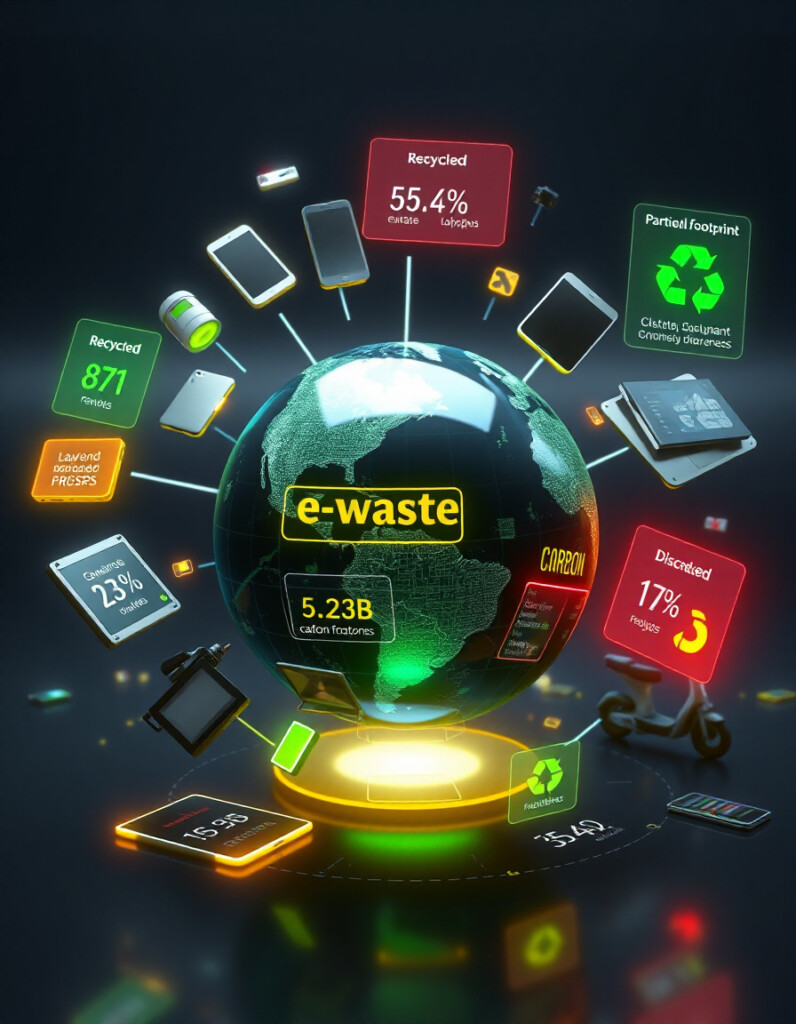
Understanding the environmental impact of electronic waste is crucial for individuals, businesses, and policymakers. From batteries to devices and components, every piece of e-waste contributes to carbon emissions, resource depletion, and pollution.
RideWattly’s E-Waste Impact Visualizer provides an interactive platform to explore global and regional e-waste data. Users can visualize how much electronic waste is generated, track CO₂ emissions, and see recovered metals — helping guide smarter, more sustainable decisions.
Whether you’re analyzing trends for Asia, Europe, or the Americas, or experimenting with uploaded CSV datasets, this tool gives instant insights into the real-world environmental cost of electronic waste. Make informed choices, compare metrics, and understand the ripple effect of discarded electronics.
Interactive dark mode chart with multiple metrics. Upload CSV optional.
FAQs & Tips
-
It allows users to explore the environmental impact of electronic waste, including CO₂ emissions, e-waste tonnes, and recovered metals, with global or regional data.
-
Yes, you can upload CSV files to visualize custom datasets alongside default global data.
-
You can view metrics for Global, Asia, Europe, Americas, and Africa.
-
The tool includes E-waste (tonnes), CO₂ emissions (tonnes), and Recovered metals (kg).
-
Yes, RideWattly provides it freely for educational, professional, and environmental awareness purposes.
-
Absolutely — you can export the visualizations as PNG images for presentations or reports.
Advanced FAQs & Pro Tips
-
CO₂ emissions are estimated based on production, disposal, and recycling processes for different electronic components, using globally recognized datasets.
-
Use the region selector to switch between continents or global data, and apply the same metric for a direct comparison of environmental impact.
-
Recovered metals include materials like copper, gold, and aluminum that can be extracted from e-waste and reused, reducing resource depletion.
-
Yes, the tool shows visible ranges and delta changes vs previous years to help understand trends and improvements.
-
The default data is based on global e-waste reports and reputable environmental studies. Uploaded CSV files are visualized as-is and accuracy depends on your source.
-
Yes, by showing the real environmental cost of electronics, it helps businesses, researchers, and individuals plan for reduced e-waste and greener practices.
Related Tools & Resources
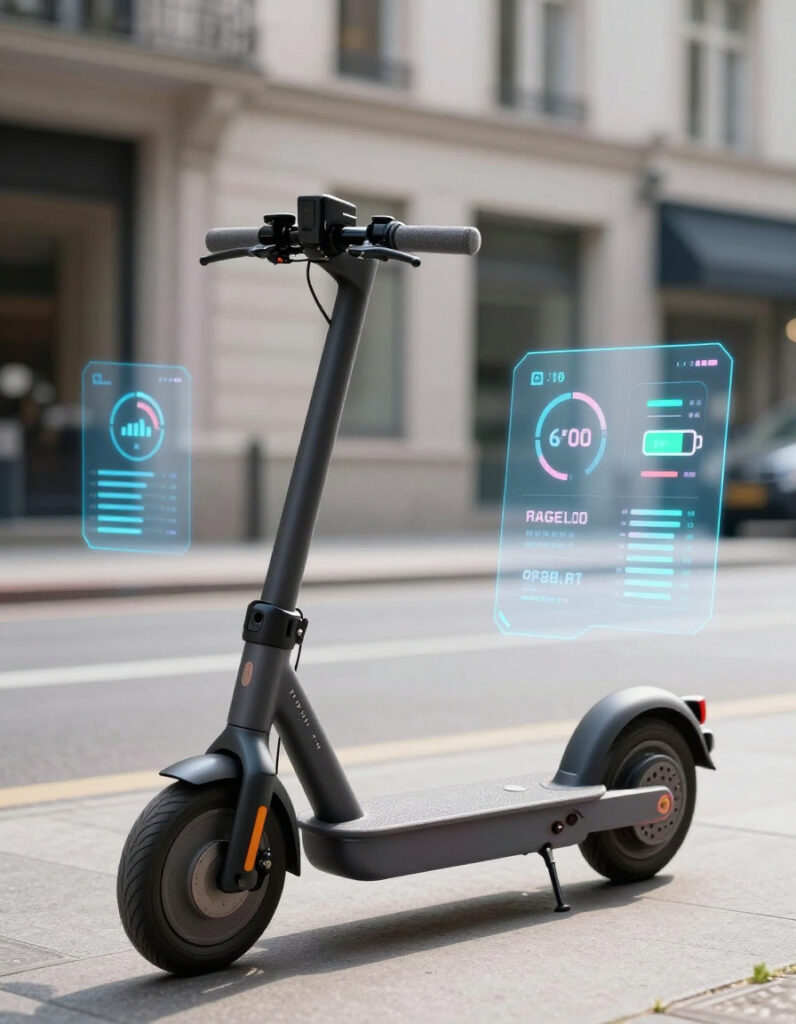
🛴 E-Scooter Range Calculator
Estimate how far your e-scooter can travel based on battery and terrain.

💰 E-Bike Cost of Ownership
Calculate total expenses for owning and maintaining your e-bike.
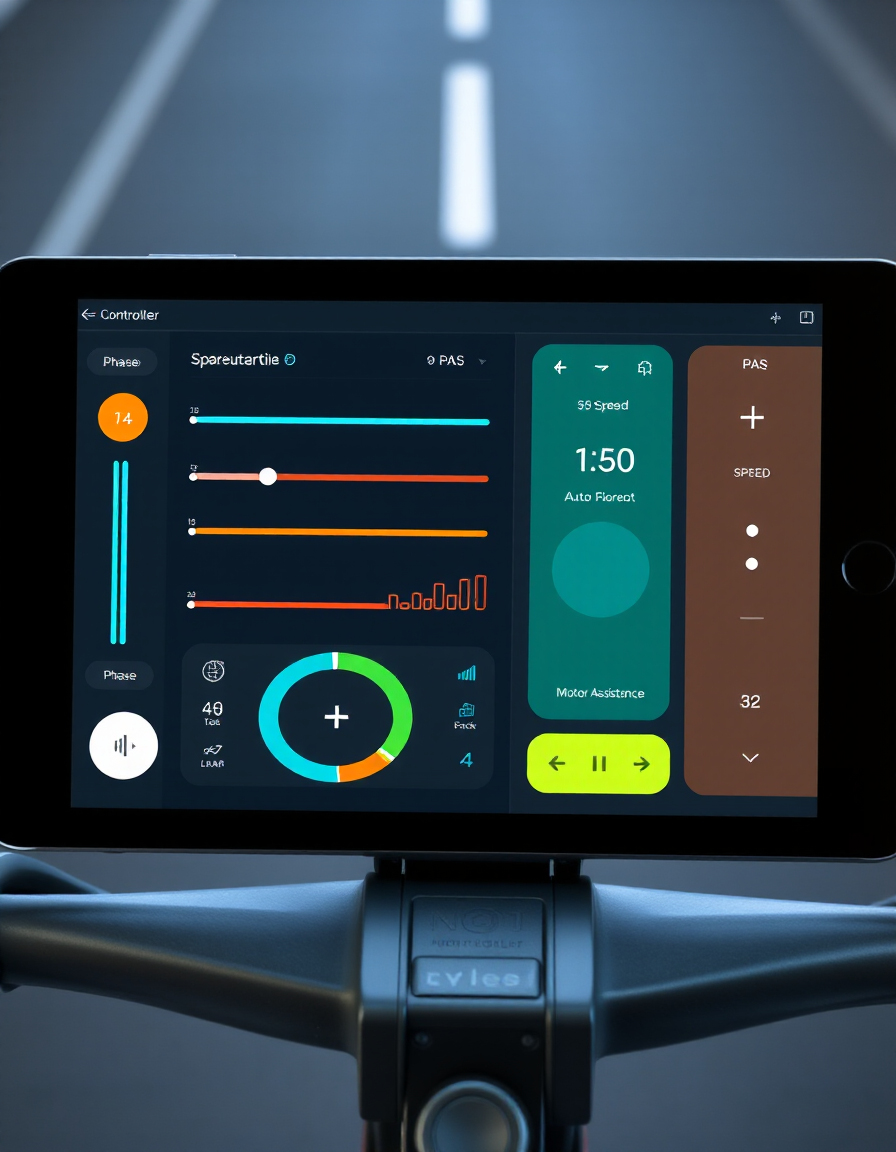
🛠️ Smart Controller Helper
Program and optimize your e-bike or scooter controller safely.

📉 Battery Efficiency Loss Calculator
See how much real usable energy your battery delivers after losses.
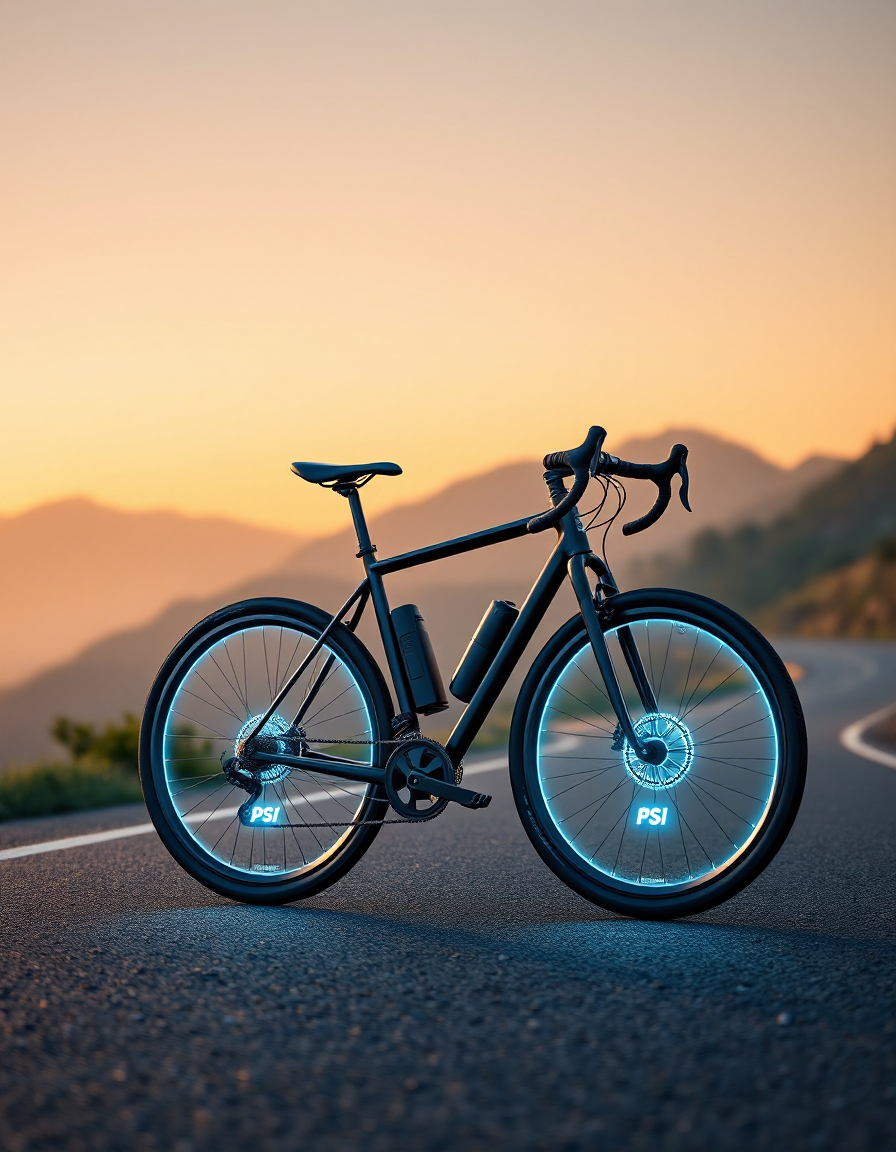
🛞 Tire Pressure Advisor
Optimize e-bike and scooter tire pressure for safety and performance.
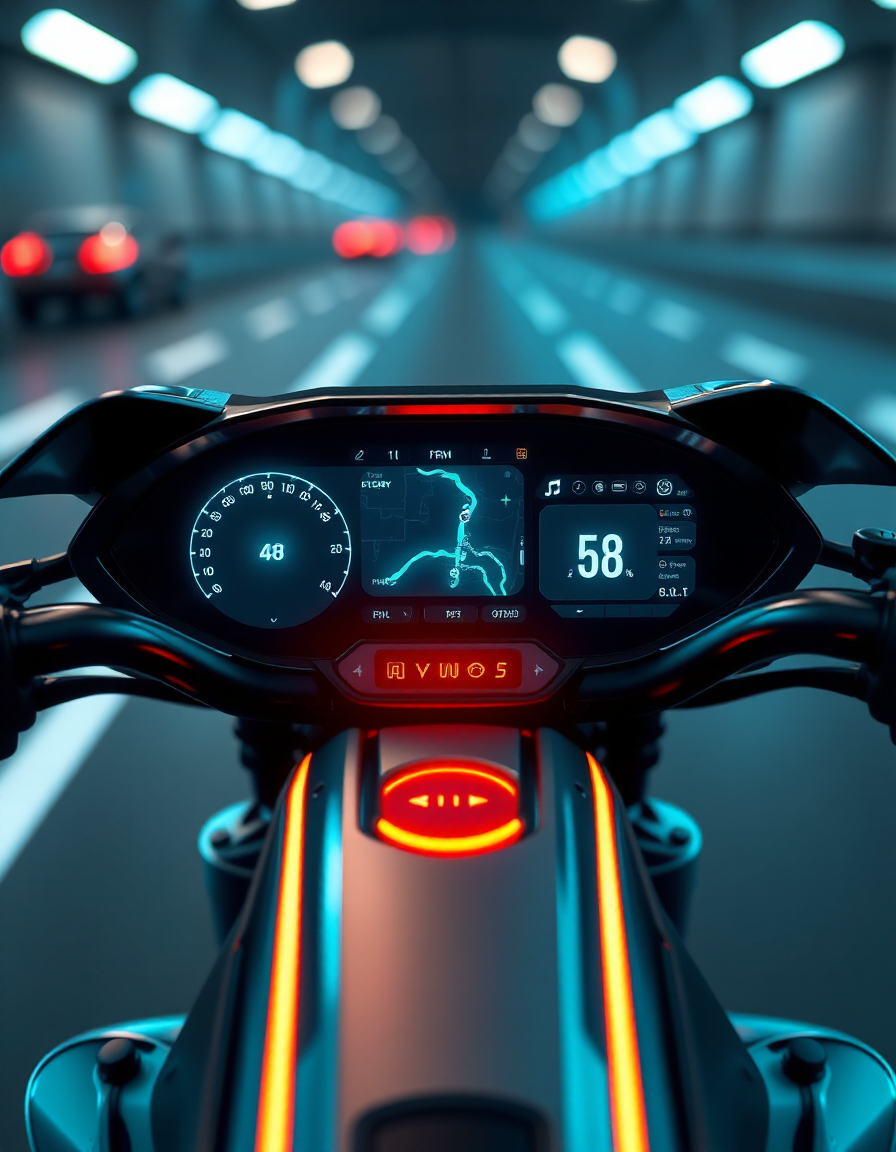
📊 E-Bike Dashboard
Monitor your e-bike’s speed, battery, and performance metrics live.
🗺️ Smart Route Planner
Plan the fastest and most efficient routes for your rides.

⚡ E-Bike Motor Power Estimator
Estimate your e-bike motor power requirements for better performance and efficiency.
🔧 Similar Tools
This tool is part of the educational resources published on RideWattly. Results should be used as a reference only and not as professional engineering advice.