🚀 New Free Tool
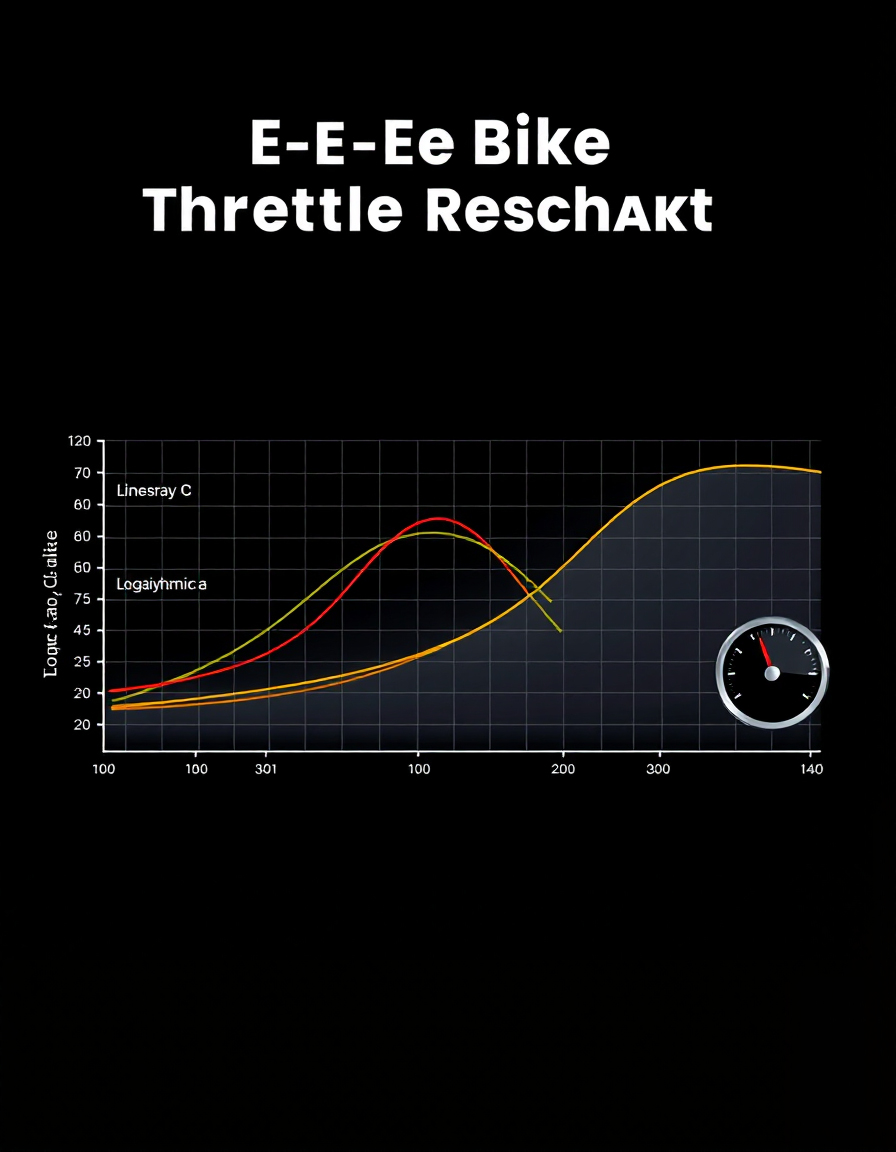
Throttle Response Curve
Customize and visualize throttle response curves for smoother and more controlled rides.
Perfect for e-bike tuning, performance optimization, and advanced riders.
⚡ Real-Time Curves
🎯 Precision Control
🚴 Ride Optimization
💯 Free to Use