Summary:
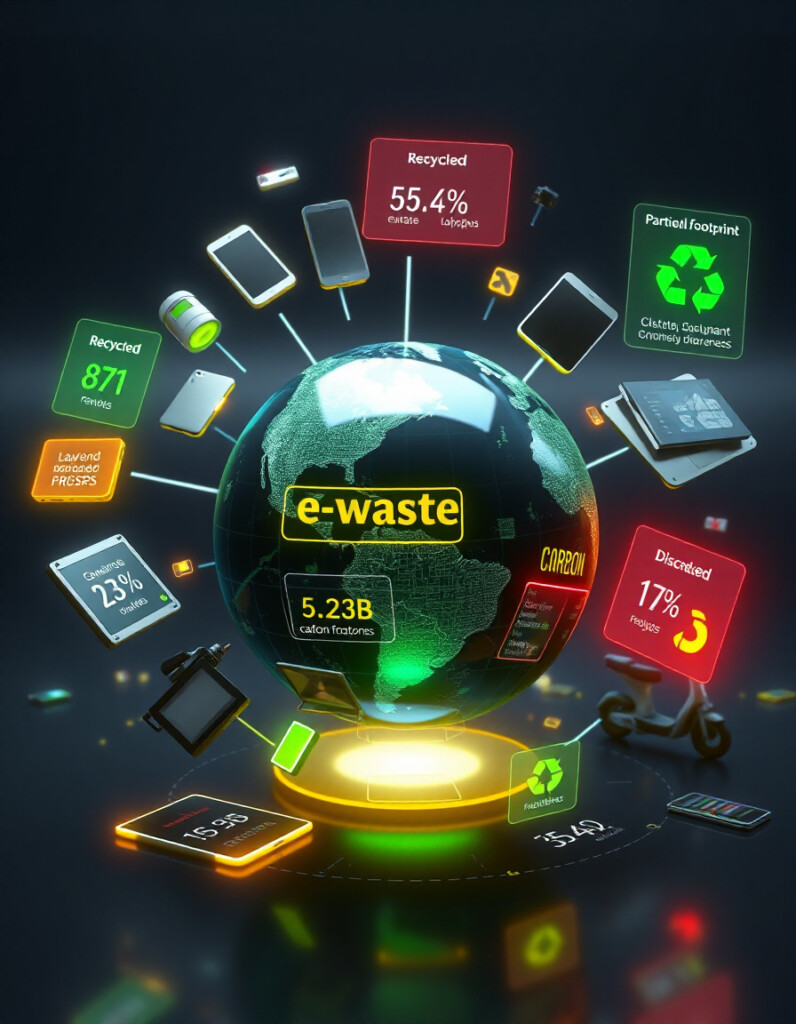
The E-Waste Impact Visualizer is an interactive tool that helps users explore the environmental impact of electronic waste. It visualizes global e-waste generation, recycling rates, and associated carbon emissions, empowering individuals, companies, and policymakers to make informed, eco-friendly decisions.
E-Waste Impact Visualizer — Interactive Environmental Data Tool
What Is the E-Waste Impact Visualizer?
Electronic waste (e-waste) is one of the fastest-growing waste streams worldwide. This tool provides a real-time, interactive visualization of how discarded electronics affect the environment. By presenting data on recycling efficiency, carbon footprint, and waste distribution, it helps users understand the magnitude of the problem and the importance of sustainable e-waste management.
Key Features
📊 Interactive Data Visualization
Explore e-waste statistics through dynamic charts, maps, and infographics that update in real time.
🌍 Global & Regional Coverage
View data from different countries and regions to compare e-waste generation, recycling rates, and environmental impact.
♻️ Recycling & Disposal Insights
Learn how much e-waste is recycled versus discarded and the corresponding carbon footprint.
🧠 Smart Environmental Analysis
Receive insights into trends, hotspots, and opportunities to reduce e-waste impact.
⚙️ User-Friendly Interface
Navigate easily, filter data by device type, country, or year, and interact with visual elements to gain deeper insights.
Why Use the E-Waste Impact Visualizer?
Understanding e-waste is crucial for sustainable electronics use. This tool allows you to:
- Track environmental impact: Visualize the carbon footprint and pollution from discarded electronics.
- Compare regions: Identify leaders and laggards in recycling and e-waste management.
- Promote sustainable practices: Encourage recycling, repair, and responsible disposal.
- Support policy-making: Data-driven insights help governments and organizations plan e-waste management strategies.
- Educate the public: Make complex environmental data accessible and engaging.
How to Use the Tool
- Open the E-Waste Impact Visualizer in your browser.
- Select a country, region, or device type from the interactive dashboard.
- Explore charts and maps to understand e-waste generation and recycling rates.
- Analyze environmental impact through CO₂ emissions and pollution metrics.
- Filter and compare data to draw actionable conclusions or share insights.
No registration or installation is required — it works instantly online.
Who Can Benefit?
- Environmental enthusiasts & educators: Learn and teach about the e-waste problem.
- Companies & manufacturers: Track product lifecycle impact and improve recycling practices.
- Policy makers & NGOs: Support decision-making with visual, data-driven insights.
- Consumers: Understand the impact of their electronic devices and make sustainable choices.
Final Summary
The E-Waste Impact Visualizer transforms complex environmental data into an easy-to-understand, interactive experience. By visualizing the effects of discarded electronics, it empowers users to take action, reduce waste, and support a sustainable future.